
August 21, 2026 | Food Packaging Automation | By PAKEWIN Engineering Team
Quick Answer
Food packaging automation reduces cost when it removes a measurable bottleneck or source of loss—not simply when it replaces a manual task. The strongest projects usually improve several cost drivers together: direct labor hours, product giveaway, packaging material waste, unplanned stops, changeover time, rework, inspection consistency and end-of-line handling.
Start with a baseline from the current line, select equipment around the real product and package, and calculate ROI from verified annual benefits. Include integration, training, maintenance, spare parts, utilities and commissioning in the investment. Count extra capacity only when there is enough demand to sell or use it.
Where Does Packaging Automation Actually Save Money?
A packaging line can lose money even when the main machine is running. Operators may wait for product, bags may be filled above target weight, film may be wasted during setup, packages may need rework, or finished cases may wait for manual palletizing. Automation creates value when it reduces these losses consistently.
The main cost categories are:
- Direct labor used for repetitive feeding, bag placement, closing, inspection, case handling or palletizing.
- Product giveaway caused by filling above the required target.
- Packaging material loss from poor forming, sealing, coding or changeover setup.
- Lost production time from minor stops, slow changeovers and disconnected machines.
- Rework, rejects and customer claims caused by inconsistent packages.
- Manual handling at transfers, inspection points and the end of the line.
- Energy and compressed-air use when equipment runs unloaded or is poorly coordinated.
NIST Manufacturing Extension Partnership guidance recommends building an automation business case around productivity, quality, waste, workforce needs and implementation readiness. This is more reliable than just comparing machine speed.
Step 1: Build a Baseline Before Selecting Equipment
Record at least two to four representative production weeks. If the product mix changes by season, include both normal and peak periods. A useful baseline contains:
- Good packages produced per hour and per shift.
- Scheduled production time and actual running time.
- Number of operators and direct labor hours by task.
- Average changeover and cleaning time.
- Product weight target, average actual weight and standard variation.
- Film, bag, label, carton and product scrap.
- Stops by cause and duration.
- Rework, rejected packages and customer complaints.
- Utility consumption where it can be measured.
- Current maintenance and spare-parts cost.
Use good output rather than gross cycles. A line producing 40 packages per minute with 5% rejects and frequent stops may deliver less saleable output than a stable line at a lower nominal speed.
Step 2: Find the Constraint Before Automating
The best automation target is usually the step limiting total line output or creating the highest recurring cost. Follow the product from feeding to dispatch and ask:
- Does the upstream process starve the filler?
- Does the filler wait for bags, trays or containers?
- Is sealing or closing slower than filling?
- Do inspection rejects stop the line?
- Does manual case packing or palletizing create queues?
- Is cleaning or changeover consuming available production time?
Automating a non-constraint can add cost without increasing final output. For example, a faster bagging machine will not improve daily production if the closing conveyor or palletizing area is already full.
Step 3: Choose the Right Automation Level
Targeted or Modular Automation
Automate one high-loss task first, such as filling, sealing, labeling, checkweighing, metal detection, case handling or palletizing.
This approach normally requires less capital and makes the result easier to measure. It suits growing food manufacturers, multiple SKUs and lines where upstream equipment will remain in service.
Semi-Automatic Packaging
An operator still presents the package or starts part of the cycle, while weighing, filling or closing is controlled automatically. Semi-automatic systems can provide a practical balance for moderate volume, frequent format changes or products that are difficult to handle automatically.
Fully Automatic Packaging Line
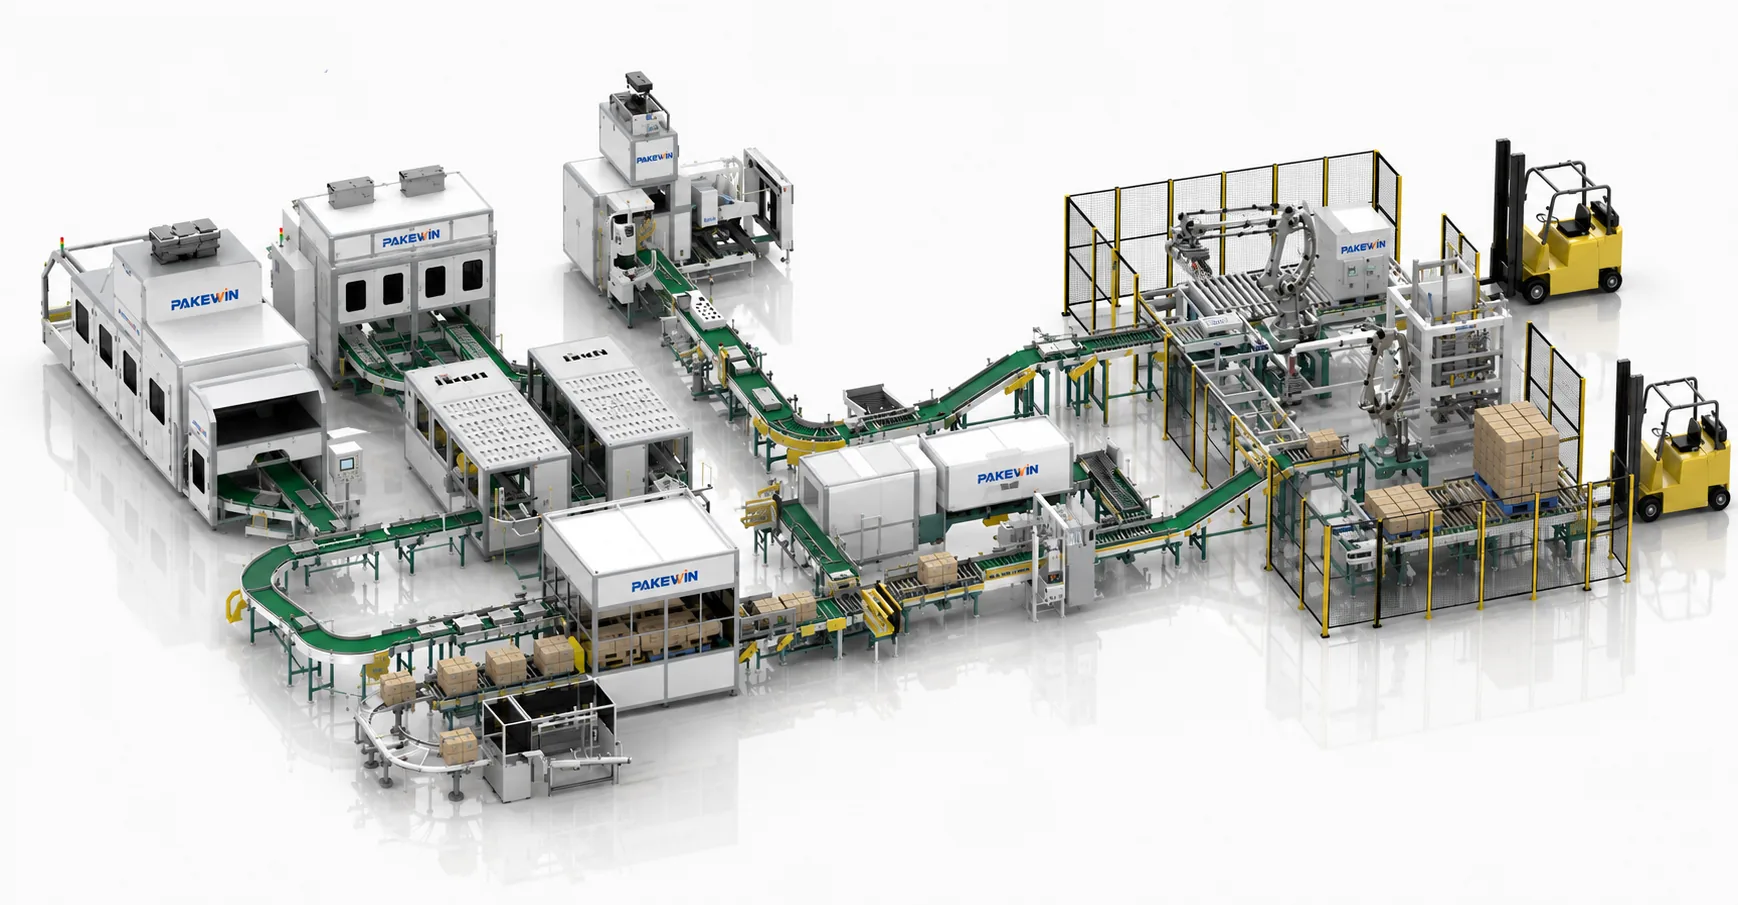
A fully automatic packaging line can connect feeding, weighing, filling, sealing or sewing, inspection, coding, case packing and robotic palletizing. It is most valuable when demand is stable enough to use the capacity and the process has repeatable products, packages and material flow.
The correct choice is not the highest automation level. It is the smallest reliable system that achieves the required output, quality and labor plan while allowing realistic changeovers and maintenance.
Step 4: Compare Packaging Machinery by Real Efficiency
Nominal Speed Versus Good Output
Ask for both maximum speed and expected sustained output with your actual product and packaging material. Include product settling, sealing time, inspection, rejection and downstream recovery.
A useful measure is:
Good packages per scheduled hour = total accepted packages / scheduled production hours
This measure exposes downtime and rejects that a cycles-per-minute rating does not show.
Changeover Efficiency
For a multi-SKU food plant, changeover can be more important than peak speed. Compare recipe storage, tool-free adjustments, replacement parts, cleaning access and the number of test packages required after setup.
Annual recovered hours = (old changeover time - new changeover time) × annual changeovers
Convert recovered hours into money only if they reduce overtime, avoid another shift or create usable production capacity.
Yield and Giveaway
For products sold by weight, small average overfills can become a large annual cost.
Annual giveaway cost = average excess weight per package × annual accepted packages × product cost per unit weight
Use verified sample data and keep legal or quality tolerances in the calculation. Do not reduce target weight without validating the complete weighing process. A filling scale controls the dose, while an in-line checkweigher can independently verify finished packages.
Quality and Reject Control
Count the cost of product, packaging, labor and lost line time for each defect category. Inspection equipment creates value when it detects out-of-tolerance packages reliably and the upstream process uses the data to correct the cause. Rejection alone is not process improvement.
Energy and Utilities
Measure motors, heaters, vacuum, compressed air and extraction under running, idle and changeover conditions. The U.S. Department of Energy documents a specific packaging-plant project in which automatic idle control reduced electricity use; that result is a case example, not a universal benchmark. Your estimate should use site measurements and local utility prices.
Step 5: Calculate Total Cost of Ownership
The purchase price is only one part of the project cost. Include:
- Packaging machinery and optional equipment.
- Conveyors, guarding, platforms and reject collection.
- Electrical, pneumatic and dust-extraction work.
- Controls integration and communication with existing equipment.
- Freight, duties, installation and commissioning.
- Factory and site acceptance testing.
- Product, film, bags and cartons used for trials.
- Operator and maintenance training.
- Initial spare parts, change parts and tools.
- Planned maintenance, consumables and software costs.
- Financing, tax and currency effects where applicable.
- Expected production loss during installation and ramp-up.
Also include annual added costs such as maintenance, utilities, calibration and technical support. A low purchase price can produce a weak ROI if the machine is difficult to change, clean, integrate or support.
Step 6: Use a Transparent ROI Formula
Separate hard savings from capacity value. Hard savings are costs that will actually disappear or be avoided. Capacity value depends on customer demand and contribution margin.
Annual labor benefit = reduced direct labor hours × loaded hourly labor cost
Annual material benefit = reduced product giveaway + reduced packaging waste
Annual quality benefit = avoided scrap + avoided rework + avoided claim cost
Annual capacity value = additional saleable units × contribution margin per unit
Annual net benefit = labor + material + quality + capacity value - added annual operating cost
Simple payback in months = total project investment / annual net benefit × 12
Three-year ROI = (three-year cumulative net benefit - initial investment) / initial investment × 100%
Use contribution margin, not sales revenue, for extra capacity. If demand is uncertain, calculate ROI once without capacity value and again with a conservative demand scenario.
Illustrative ROI Example
The following is a hypothetical example for method only. It is not a performance promise or quotation.
Assumptions:
- Total installed project investment: USD 180,000.
- Labor redeployment benefit: USD 64,000 per year.
- Reduced giveaway and packaging waste: USD 18,000 per year.
- Reduced rework and handling loss: USD 12,000 per year.
- Usable additional capacity contribution: USD 25,000 per year.
- Added maintenance, utilities and support: USD 15,000 per year.
Calculation:
- Annual net benefit = 64,000 + 18,000 + 12,000 + 25,000 - 15,000 = USD 104,000.
- Simple payback = 180,000 / 104,000 × 12 = approximately 20.8 months.
- Three-year ROI = (104,000 × 3 - 180,000) / 180,000 × 100% = approximately 73%.
A conservative case that excludes capacity value gives an annual net benefit of USD 79,000 and a payback of approximately 27.3 months. Showing both cases makes the decision more robust.
Step 7: Test the System with Real Products
Before purchase, provide representative products, packaging materials and worst-case formats. A meaningful test should confirm:
- Stable feeding and product transfer.
- Average good output at the target rate.
- Filling or weighing performance.
- Seal, closure and package appearance.
- Inspection and reject operation.
- Changeover procedure and duration.
- Cleaning access and contamination controls.
- Alarm recovery after realistic interruptions.
- Interface signals with upstream and downstream machines.
Document acceptance criteria before the test. Maximum speed in an empty demonstration is not sufficient evidence for production ROI.
Step 8: Plan People, Safety and Ramp-Up
Automation changes work rather than eliminating the need for people. Define who will operate, clean, maintain, troubleshoot and improve the line. Include training time and realistic ramp-up losses in the project plan.
OSHA guidance for material handling recommends mechanical aids and conveyors where appropriate to reduce lifting and repeated manual transfer. The final line still requires a site-specific risk assessment, guarding, emergency stops, safe access and local regulatory review.
Track results for the first 30, 60 and 90 days against the original baseline. Review good output, downtime, rejects, changeovers, labor hours, giveaway and maintenance. If the gains do not appear, investigate the constraint rather than assuming the equipment alone will solve it.
A Practical Supplier Comparison Checklist
Send the same application data to every supplier and compare:
- Confirmed product and package range.
- Sustained good output under defined conditions.
- Number of operators by shift.
- Changeover and cleaning procedure.
- Product-contact materials and hygiene design.
- Inspection, rejection and traceability requirements.
- Utility consumption and connection details.
- Integration responsibility and control interfaces.
- Acceptance-test method.
- Warranty, training, remote support and spare parts.
- Total installed cost and annual operating cost.
- Assumptions used in the ROI estimate.
Ask each supplier to state exclusions. This prevents a low equipment price from hiding conveyors, guarding, installation or software that will be required later.
Frequently Asked Questions
How does food packaging automation reduce labor cost?
It can reduce repetitive direct labor in feeding, bag handling, closing, inspection, case handling and palletizing. Calculate the benefit from actual hours removed or redeployed, including the loaded labor cost. Do not assume every operator position disappears immediately.
What packaging process should be automated first?
Start with the verified constraint or highest recurring loss. This may be filling, sealing, inspection, changeover, case handling or palletizing. Automating a non-bottleneck may not increase total line output.
What is a good payback period for packaging machinery?
There is no universal good payback period. It depends on capital policy, equipment life, demand risk, financing, service support and the certainty of savings. Compare a conservative case with an expected case and document every assumption.
Should additional output be counted in ROI?
Only when the factory can use or sell that output. Value it using contribution margin rather than total sales revenue. If demand is uncertain, show ROI both with and without the capacity benefit.
Is the fastest packaging machine always the most efficient?
No. Final efficiency depends on accepted output, downtime, changeovers, rejects, cleaning, maintenance and downstream constraints. Sustained good packages per scheduled hour is more useful than maximum cycles per minute.
What information is needed for an automation proposal?
Provide product characteristics, package formats, target weights, required output, current labor, layout, utilities, cleaning requirements, inspection needs, changeover frequency and representative samples. This allows a supplier to evaluate the complete process rather than quote one machine in isolation.
Conclusion
Food packaging automation lowers cost when the investment is tied to measured production losses and a realistic operating plan. Build a baseline, identify the constraint, select the appropriate automation level, test real products and calculate ROI from transparent assumptions.
PAKEWIN can review your product, package, required output, current process and factory layout to configure a modular machine or complete packaging line. Send your application details for a preliminary packaging line assessment.